On October 20th, the Rainstorm Glen high-altitude weather balloon project ascended to ~103,000ft in the atmosphere to take pictures and collect data with electronic sensors. The team began working on the project on August 27th and spent the next eight weeks researching the details and logistics of launching and safely recovering a balloon with an electronic payload.
At the start of the project, we had a variety of problems to solve and difficulties to address. As project manager, I split the class into teams to handle the different aspects of refining our launch procedures. Gaps in our knowledge included FAA regulation of weather balloons, safe launch and recovery, design of the payload in terms of contents and integrity in extreme conditions, etc.
FAA Regulation
As we discovered in the Electronic Code of Federal Regulations, regulations apply to unmanned free balloons that
(i) Carries a payload package that weighs more than four pounds and has a weight/size ratio of more than three ounces per square inch on any surface of the package, determined by dividing the total weight in ounces of the payload package by the area in square inches of its smallest surface;
(ii) Carries a payload package that weighs more than six pounds;
(iii) Carries a payload, of two or more packages, that weighs more than 12 pounds; or
(iv) Uses a rope or other device for suspension of the payload that requires an impact force of more than 50 pounds to separate the suspended payload from the balloon.
Our final payload weighed 4 lbs, and the smallest surface of our payload was 78 square inches. Dividing 64 oz by 78 in² gives a result much less than 3 oz/in², so we were covered there. Despite being unregulated, we called the FAA to give them a heads up a few days before our launch, and then again immediately before. They seemed pretty okay with everything.
Launch and Recovery
The tasks associated with launching the balloon and recovering it were generally divided into subtasks: finding suitable locations, designing the non-payload aspects of the balloon. We decided to find a safe landing area and calculate the launch position from that, to ensure that the balloon didn't end up on a roof or in the ocean. Using Balloon Track prediction software, we eventually settled on an open area to launch on the next clear weekend after project completion. By inputting the latitude and longitude of the desired landing location (courtesy of Google Earth), the program would use current weather conditions to project a flight path, giving us a general range of possible launch places.
In ensuring the payload would descend at a reasonable velocity, we chose this parachute for its tangle-free netting to reduce the risk of interference when it needed to open. The parachute came with a slit on the top center, which we cut to run a line through the parachute from the payload to the balloon. Its position in the center would mean that it would have slack with the support of the balloon on ascent, and then open to carry the load at burst. We fastened the payload to the balloon using plenty of rope and zipties for reinforcement. Finally, the balloon itself came from Kaymont, who were very helpful over the phone with advice. We considered factors such as the burst radius and capacity.
Payload Design
For electronic sensors, we chose to use a combination of the Seeeduino v3 and an Arduino Uno R3. To the Seeeduino, we mounted an SD card shield so we could log sensor inputs to persistent external storage. Overall, programming for the Seeeduino wasn't amazing because the drivers were incompatible with Windows 7, forcing me to use XP. However, everything worked swimmingly in the final sketch, which fundamentally was the example sketches for each sensor combined - no wheel-reinventing here. Our sensor array included a temperature sensor with a range down to what could be expected at burst altitude and a pressure/temperature sensor for internal temperature and potential pressure to altitude conversions soldered to a perfboard and connected to the Seeeduino, and an amazing, self-sufficient GPS sensor connected to the Arduino Uno. The GPS sensor, with an external battery and storage, logged timestamps and latitude, longitude, and altitude.
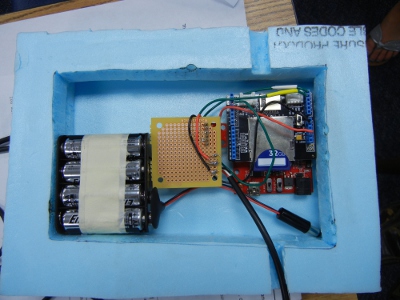
Our remaining electronic apparatus was not self-assembled. The payload carried 2 GoPro cameras to take pictures and an iPhone 4 as the primary means of recovery by sending GPS position over cellular data (using Instamapper).
Our payload box was built with styrofoam cut from large sheets into our payload carrier design shape. The design split payload components into separate compartments to efficiently preserve heat with hand warmers and distribute weight. We had a hole in each side at different angles measured to the size of the camera lens, and a small hole through which to run a temperature sensor. The styrofoam was assembled in multiple layers to insulate from the very low external temperatures and to help with any impact upon landing.
Launch Day
On the morning of the launch on October 20th, final assembly of the payload took place as we secured the contents of the box with tape, started the cameras, and connected the wiring of the sensors. We fastened the payload and the balloon with rope (taut-line hitch) and filled the balloon with helium from a local supplier. After we released the balloon, it was the last time we saw it for quite a while. The iPhone battery did not last the flight, and we received no landing location from it. Fortunately, it was recovered in an open field by a local farmer a few weeks after the launch.
Data Analysis
When we recovered the payload, the pertinent pieces of data we needed to retrieve were the log from the SD card, the internal storage of the GPS board, the location log from the iPhone, and pictures and video from each of the GoPros. Unfortunately, the camera batteries did not last the whole flight, which was unexpected; I suspect that the handwarmers took effect too soon, before the payload had escaped warm temperatures. Thankfully, the still shots continued up to burst altitude, and were successfully recovered. The GPS returned data in an XML-like format, providing amazingly useful timestamps, latitude and longitude, and altitude readings. The SD card log also functioned perfectly, storing 42MB of internal and external temperatures, pressure, and projected altitude. Although the SD card log was not timestamped, the loop was set to sleep for a second between each reading. The key to correlating the two datasets was the altitude commonality. Using the pressure reading from the barometric sensor, we obtained a projected altitude using a rearrangement of the equation
z = 44330.76 - 4946.54 * P0.1902632
where z is altitude in meters and P is pressure in pascals, the derivation of which reflects a somewhat idealized calculation uncompensated at mean sea level, explaining why the projected altitude is much lower than the experimental altitude. I then wrote a quick program in Java to process the sets and pick out the maximum height measurement (representing burst altitude), and then matched the datasets as vectors in GNU Octave. By linking the datasets, we could cross reference timestamps with temperature readings, altitudes with experimental pressures, etc., opening the potential for much more understanding, and enabling the creation of cross-dataset graphs.
For the actual plotting of data, I used GNU Octave for its gnuplot capabilities. Most notably, I'd like to draw attention to the interactively rotatable 3-dimensional plot of the flight path, using latitude and longitude for x and y and altitude for z as expected. This was created by printing 180 plots in Octave to file out with the azimuth varied by 2 degrees per image (seen below), and then chaining them together with the 360 Image Slider in JavaScript. From this graph, you can observe that the initial ascent was subject to the whims of the wind; the balloon did in fact start out traveling northward, and then turned to the south in accordance with our predictions. At a certain altitude (unscientifically, a little under 20,000 m on the graph), the wind direction begins to vary more greatly at each interval of altitudes, creating a stratified stretch where the balloon is tossed about for a while. Finally, at burst, we assume that since the atmosphere is thinner, the payload freefell for a while before the parachute opened, explaining why on the descent, the path was much straighter at the previously tumultuous altitudes; the downward falling overpowers the lateral push.
Octave 3D Plot Function
function graph3D()

fid = fopen ("gpsoctave.txt","r");

count = fscanf(fid,"%d",1);
top = fscanf(fid,"%d",1);
latup = fscanf(fid,"%f ",top);
latdown = fscanf(fid,"%f ",count-top);
longup = fscanf(fid,"%f ",top);
longdown = fscanf(fid,"%f ",count-top);
hgtup = fscanf(fid,"%f ",top);
hgtdown = fscanf(fid,"%f ",count-top);

fclose (fid);

plot3(longup,latup,hgtup,"color",[0,.5,.5],"linewidth",2);
hold on;
plot3(longdown,latdown,hgtdown,"color",[.25,0,.5],"linewidth",2);
hold off;

legend("Ascent","Descent");

title("Flight Path of Rainstorm Glen");
xlabel("Longitude");
ylabel("Latitude");
zlabel("Height\n(m)");

flag = 0;
if(flag==1)
  for i=1:180,
    view(-37.5+(i*2), 30);
    print(strcat("3dplot",int2str(i),".png"));
  end;
else
  print("3dplot.png");
end;

end;
Personal Thoughts
The Rainstorm Glen project was a fantastic learning experience. The team learned to work together and gained valuable experience working with electronics and soldering. Researching the project drew together interest in physics with real world application. Programming for Arduino was unique from a CS perspective because it involved much more of the EE aspect of considering circuits and microprocessors. Data processing with Octave was especially fun because of the varied possibilities in presenting information effectively. Projects of this nature are a rare opportunity, and we are fortunate to have been able to conduct it successfully. Final data analysis and photo gallery from the project can be found at the Rainstorm Glen page.